
Today we are going to look at how the market has evolved over time and what that means as we move forward, particularly when comparing cash-only environments with cashless and hybrid models.
If you look at the long-term data – starting back in January 2007 – we’ve been tracking performance against RPI across millions of plays. For a long period, the sector lagged behind inflation quite significantly. That gap widened particularly around 2014, when stakes rose from £70 to £100, and for a long time growth failed to keep pace with inflation.
What’s interesting is that traction really started to return when digital and cashless technologies began to take hold. You can clearly see a recovery phase, where performance begins to catch up again. That trend has continued post-COVID, and in some periods we’ve even slightly outperformed inflation.


That’s an important point for anyone considering future investment. The level of investment being made by manufacturers and operators is delivering stronger returns to the marketplace than in the past.
Looking at the last three years specifically:
- Coming out of COVID, the first year saw growth of around 13.9%
- The following year growth was approximately 9.3%
- This year growth has slowed to around 5.5%
These figures track turnover, not profit, but they still demonstrate sustained recovery and stabilisation.
In terms of market quality, the overall shape hasn’t changed dramatically in recent months. What has changed is the number of products coming online. We’re now tracking a wider range of machines and formats, which slightly alters the percentages, but overall these newer products still represent a relatively small proportion of the total market.
When we look at overall market size, we estimate annual turnover at around £5.7 billion. Breaking that down:
- £5.6bn from AWPs
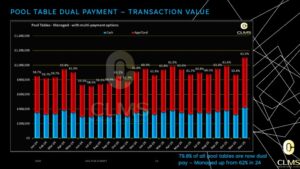
- Around £46m from pool tables
- Approximately £6.6m from music systems
- Around £37m from other categories
While some areas remain smaller, collectively they still represent a significant and growing revenue base.


Turning to player behaviour, one of the most notable changes in the last four months has been the rapid adoption of cashless and app-based payments.
Originally, app-based play accounted for around 2.9% of transactions, with cashless under 1%. That figure has now risen to over 5%, and continues to grow. We are currently monitoring just over 5,000 machines, and across those machines:
- 88% of transactions now involve card or app-based interaction
- This compares to around 66–67% at the same point last year
That represents a very significant shift in a relatively short period.
The highest weekly spend recorded via cashless methods has reached around £712, and cashless play accounts for roughly 4.6% of active weeks across monitored machines. The hold percentage on app-based play is around 32%, compared to approximately 29% for traditional cash play.
This suggests that players behave differently when using digital payment methods – they are more likely to reinvest winnings rather than cashing out immediately. From an operator perspective, this can be positive, as it supports longer engagement and higher reinvestment.
We’ve also observed this behaviour in mixed environments. For example, in sites where a ticket machine is placed close to traditional cash machines, cashless adoption still outperforms expectations. Across all cashing systems, we’re seeing overall utilisation of around 16%, with some environments performing significantly higher.

Traditional machines still perform well, but there is a clear and growing preference for cashless options, particularly in environments like hotels, where guests are less likely to carry cash.
Seasonal factors also play a role. Over the Christmas period, for example, there was noticeably more cash in circulation, which temporarily affected the balance between cash and cashless play.
Looking ahead, manufacturers are becoming increasingly sophisticated in how systems are designed, with better cost efficiency and improved player experience. As these improvements continue, we expect cashless and hybrid play to rise further – potentially exceeding 70% adoption next year.
Overall, this shift appears organic rather than forced. Cash remains important, but giving players choice – and control – is driving higher engagement and better performance.
Thank you.
To view the slideshow click on the link below
